Data visualizations
Explore your data with interactive and easy customizable data output visualizations without any coding or scripting
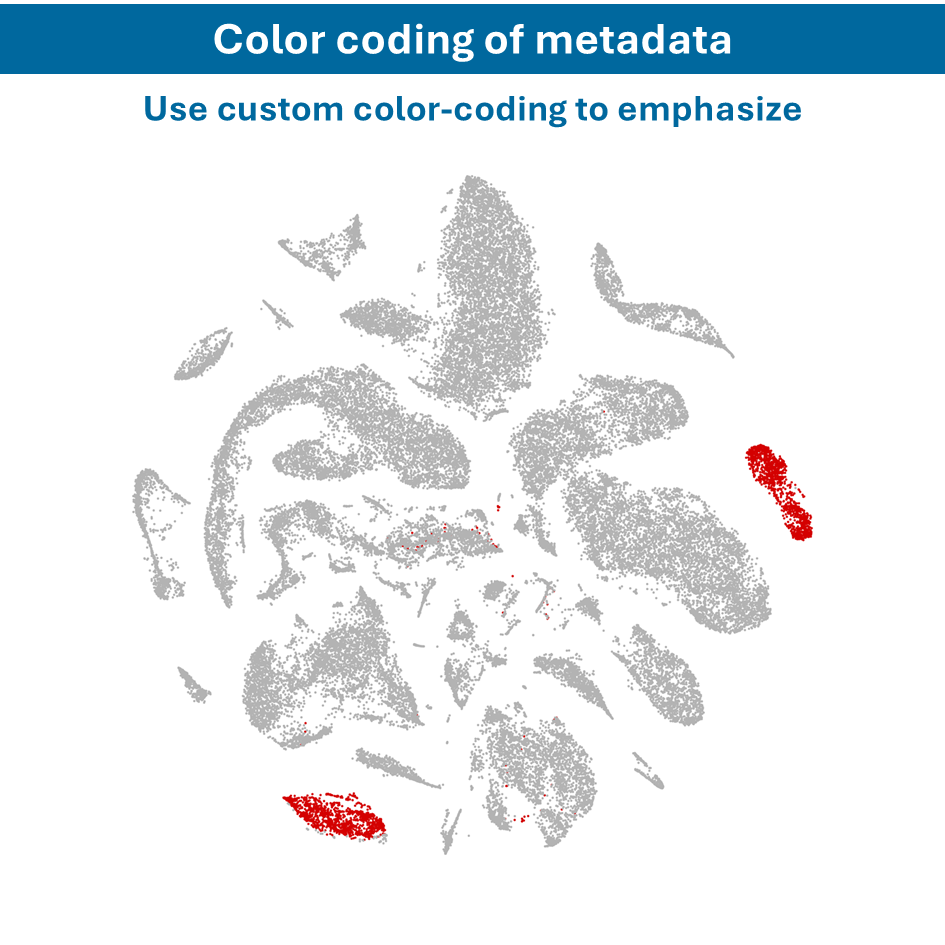
Key Features
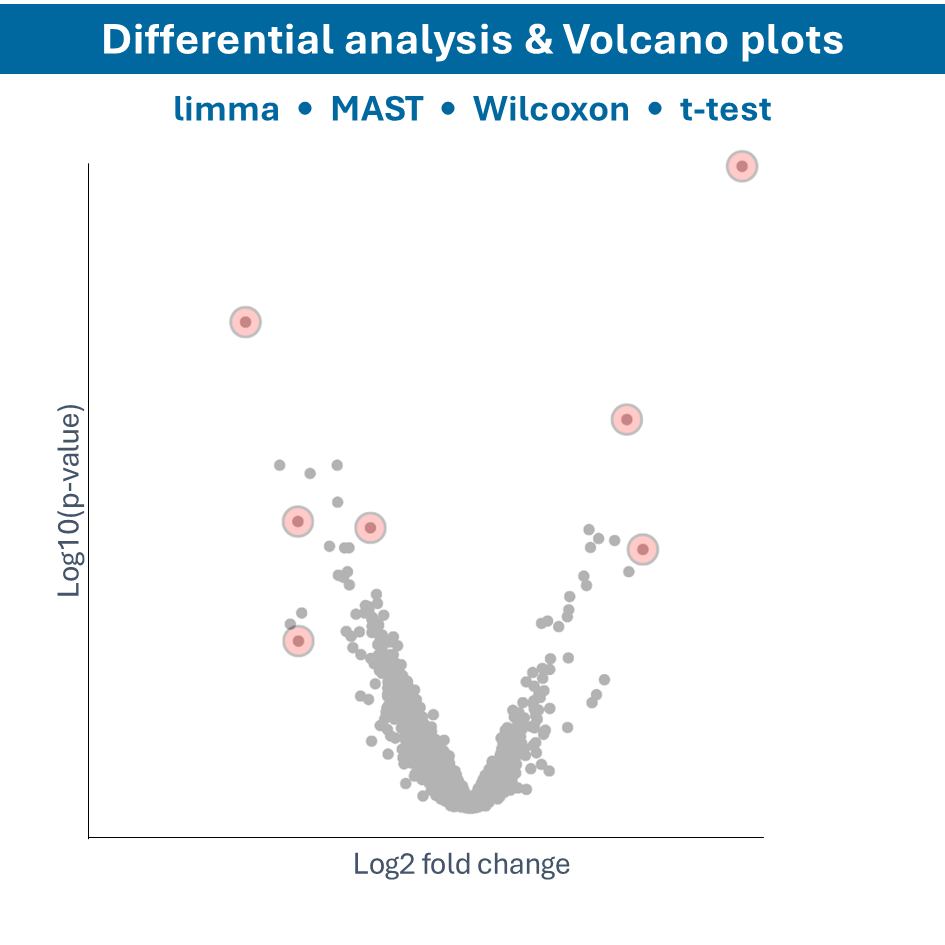
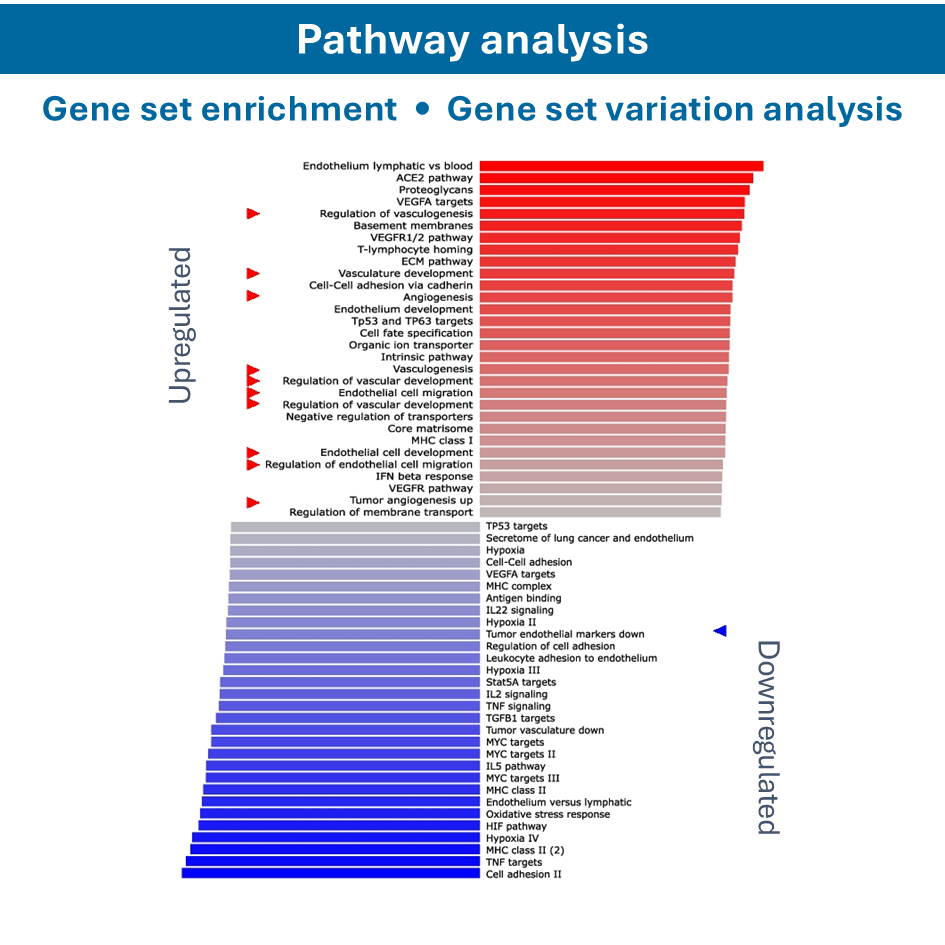
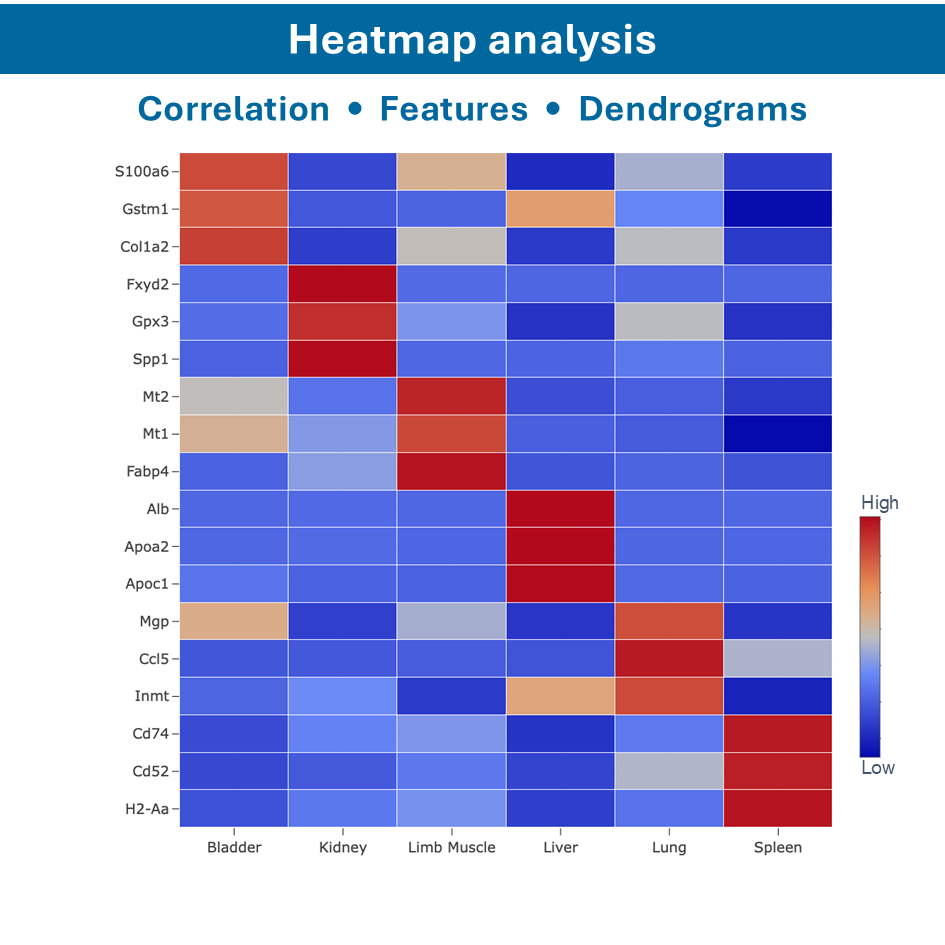
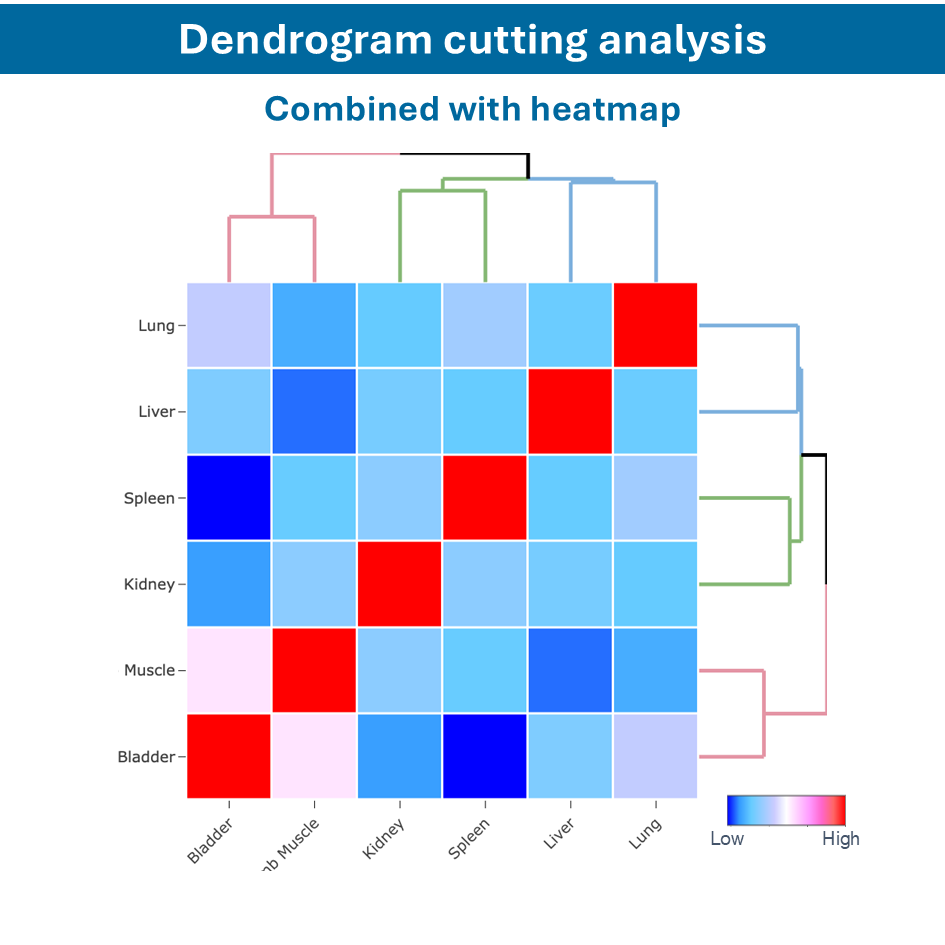
No coding, 40+ out of the box algorithms and visualization options
Publication ready figures with highly customizable plots
Interactive data exploration
Introducing revolutionary easy data visualization capabilities marks a significant leap forward in how you can perceive and understand complex datasets.
The UniApp’s innovative approach combines state-of-the-art visualization techniques with user-friendly interfaces to streamline the process of transforming data analyses into meaningful insights.
By leveraging intuitive point-and-click functionalities and interactive features, you can effortlessly create meaningful representations of your data. Fully customizable plots without the need for specialized technical skills, available for Single cell, Spatial and Multi-omics datasets.

No coding, 40+ out of the box algorithms and visualizations
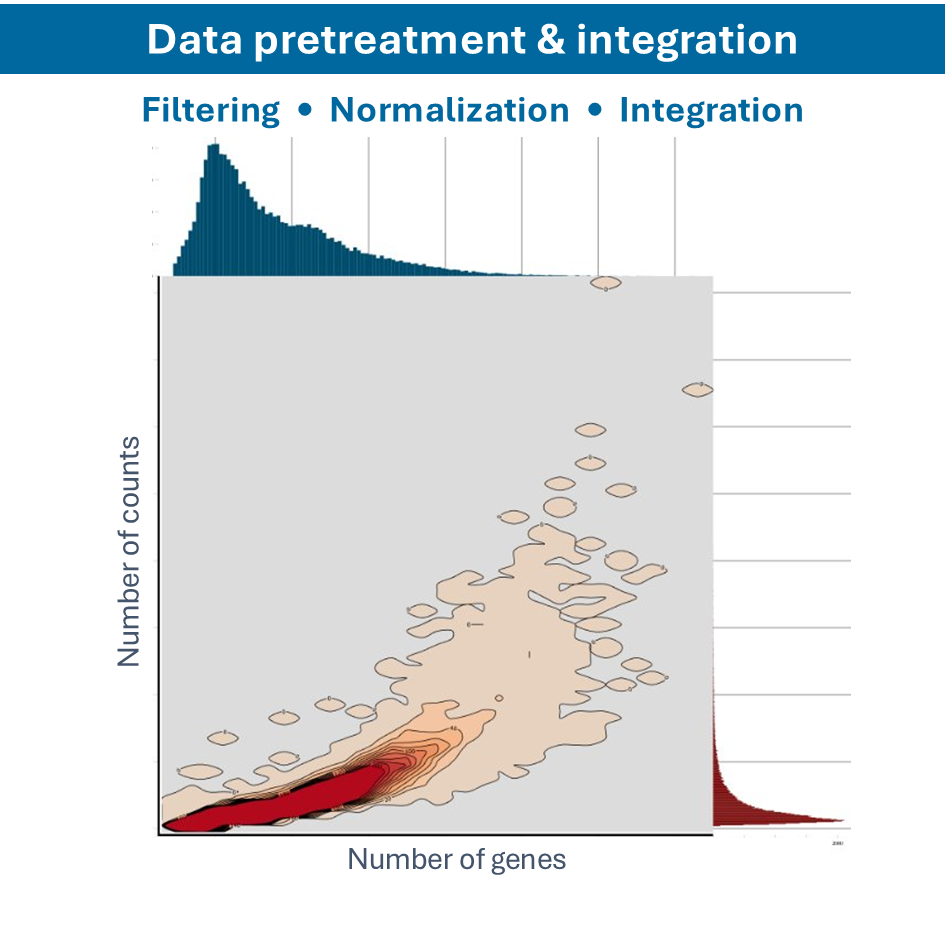
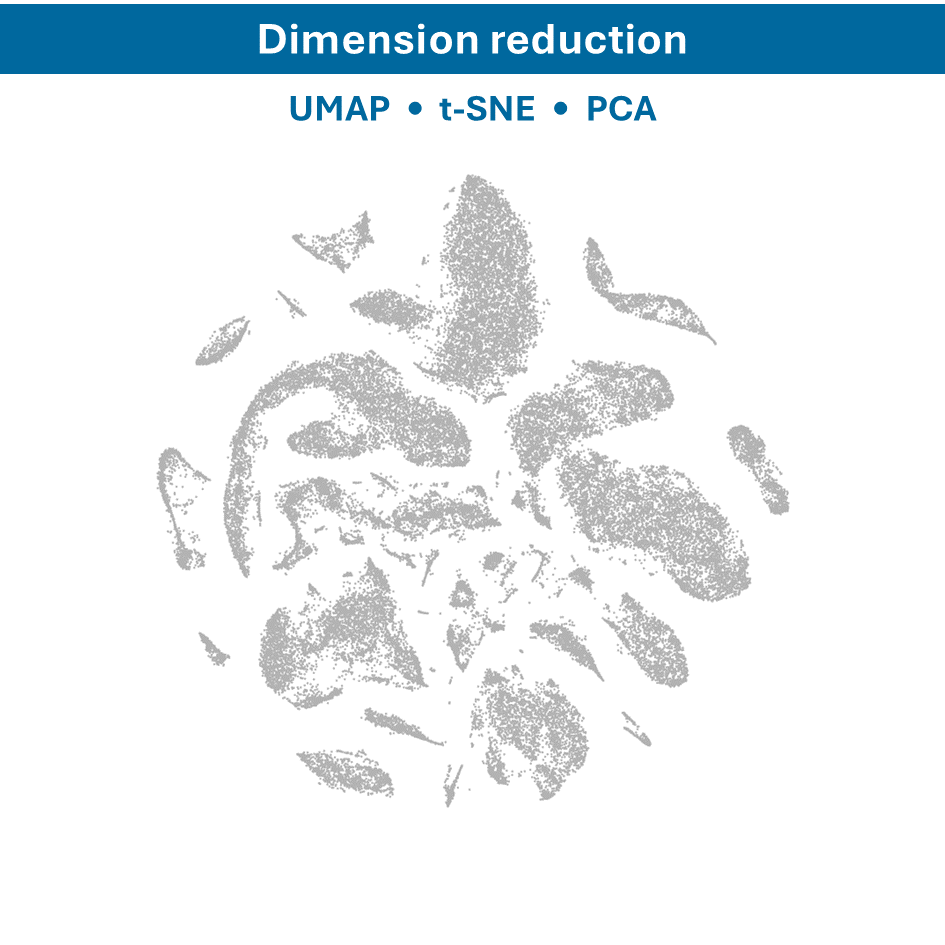
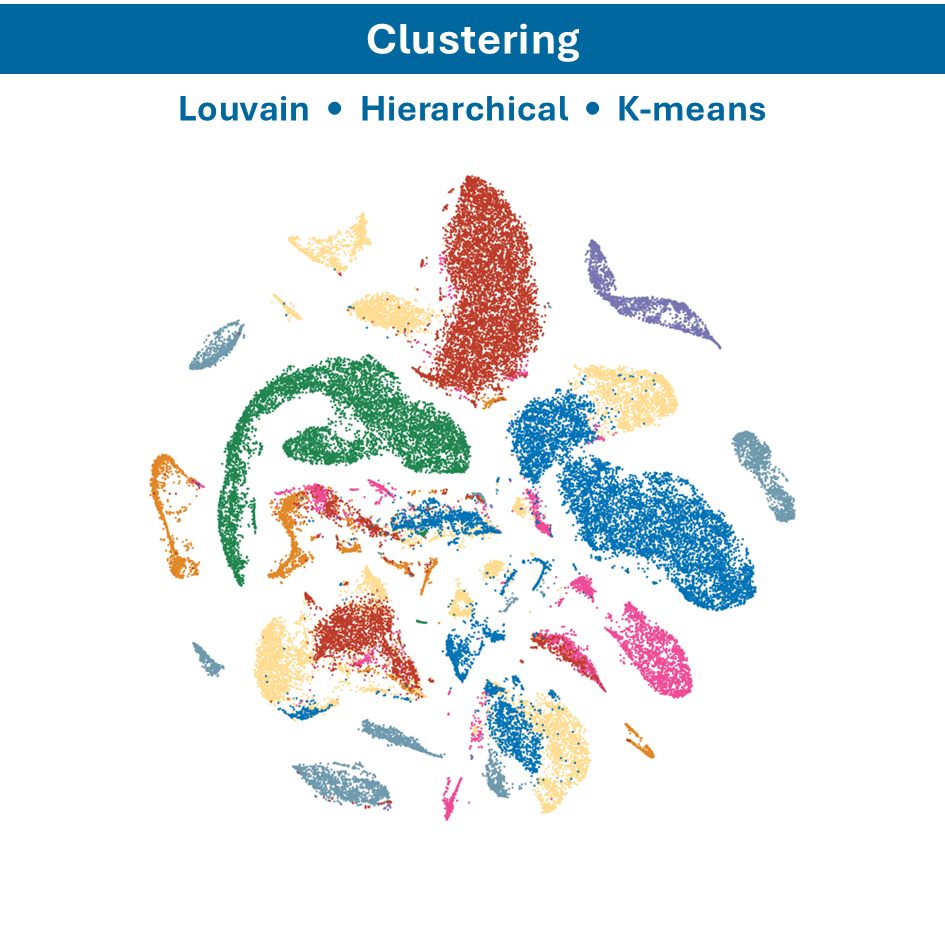
Creating biomedical data visualizations has never been easier, thanks to UniApp’s no-code approach. With our intuitive platform, you can effortlessly generate visualizations, by simply selecting your plot type of choice. Once your visualizations are created, you can easily customize them to suit your needs, including color coding and other stylistic adjustments. The UniApp allows you to spend more time deriving meaningful insights rather than struggling with coding or manually uniform plot outputs once your analysis is completed.
This seamless process ensures that your focus remains on interpreting the data and making informed decisions. Learn how other users use the visualization options to perform quick data screens to validate data quality controls and validating usefulness for hypothesis testing.

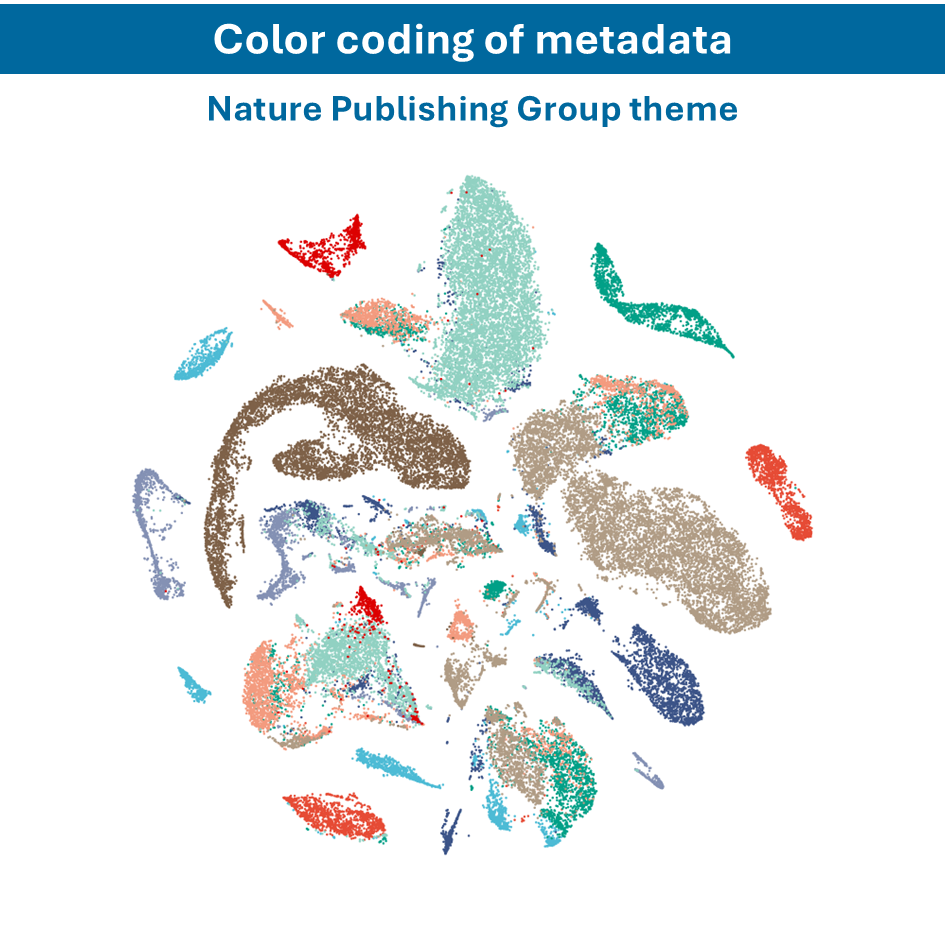
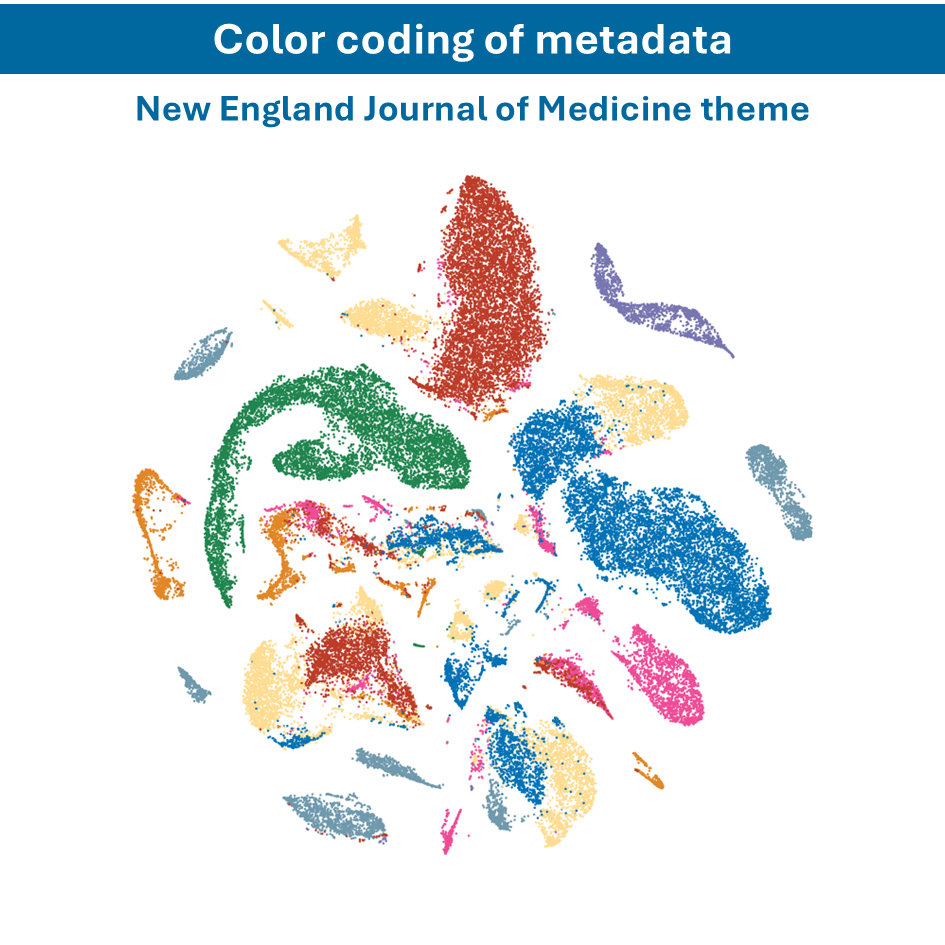
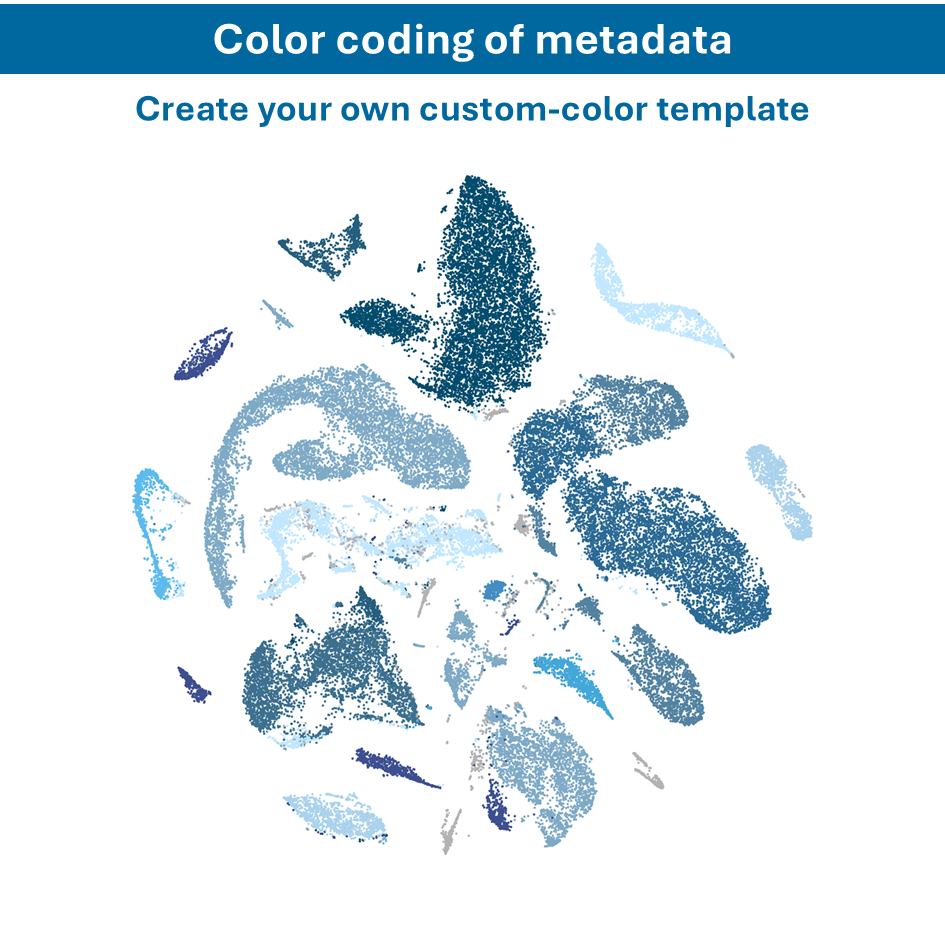
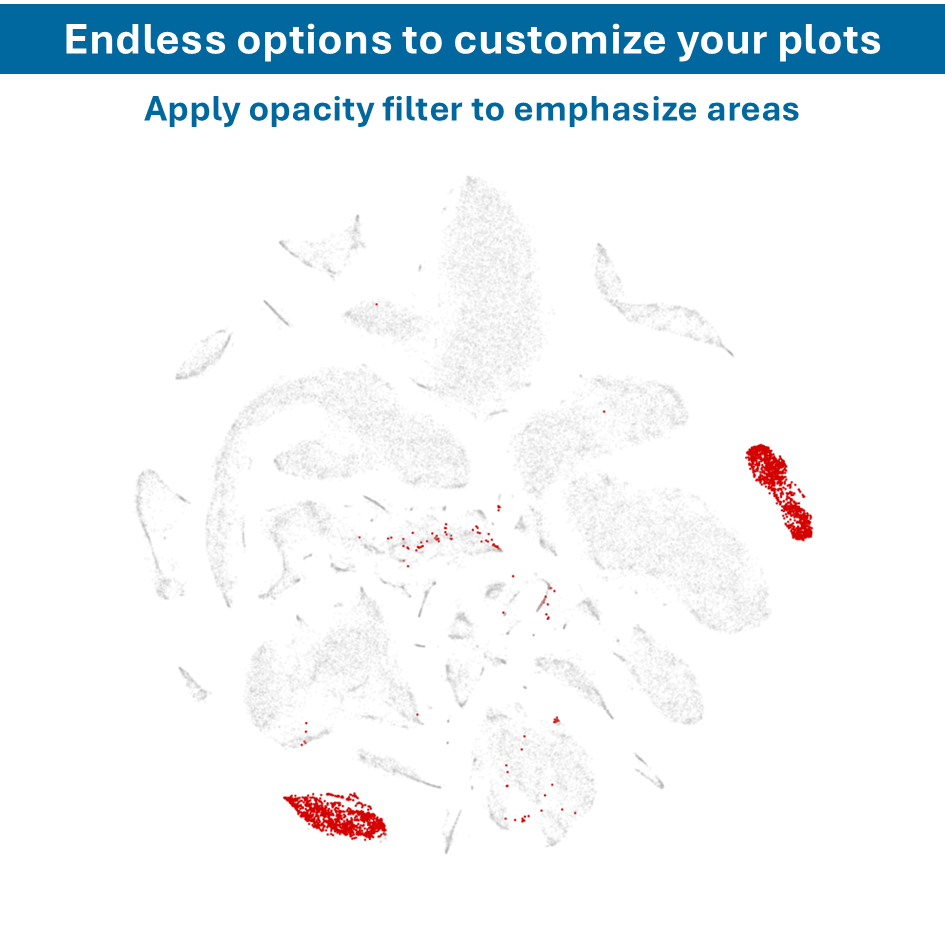
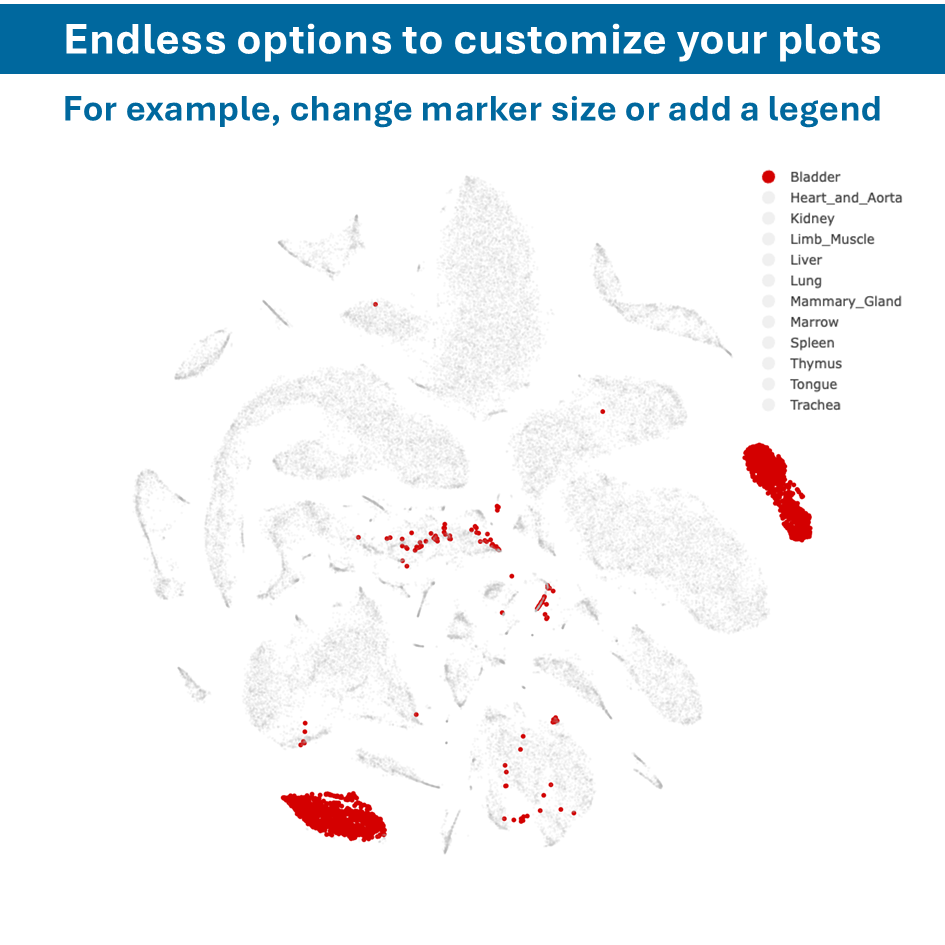
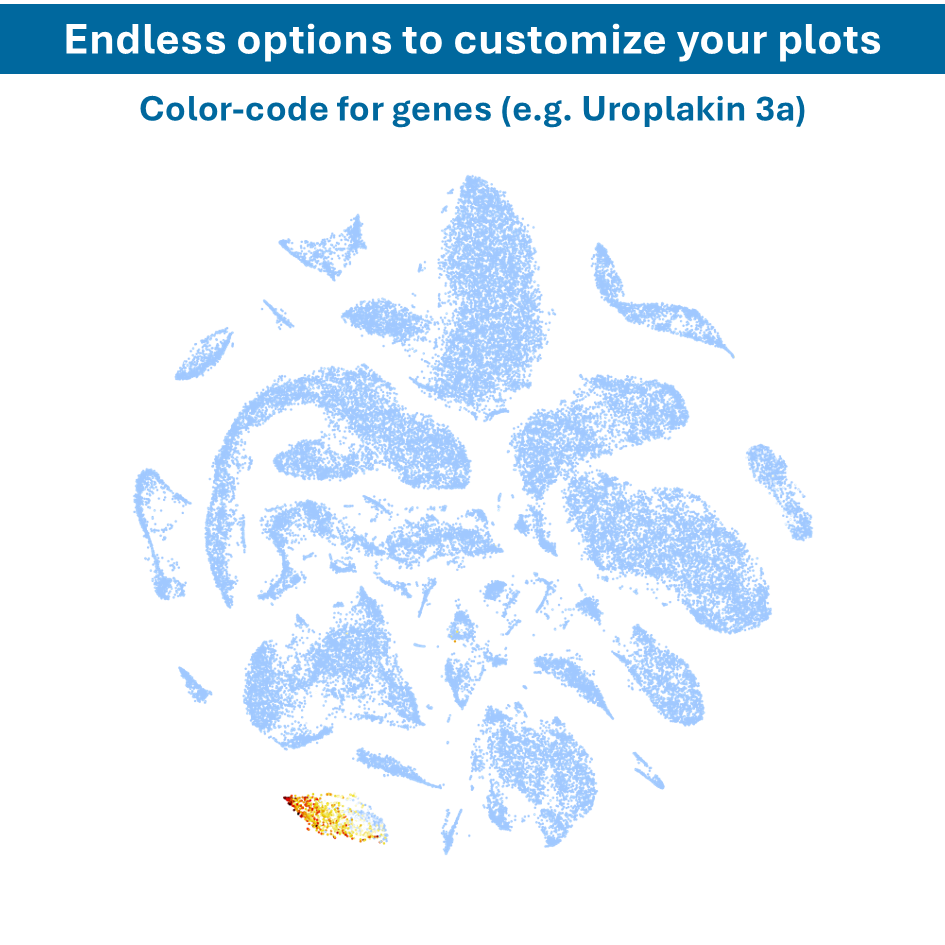
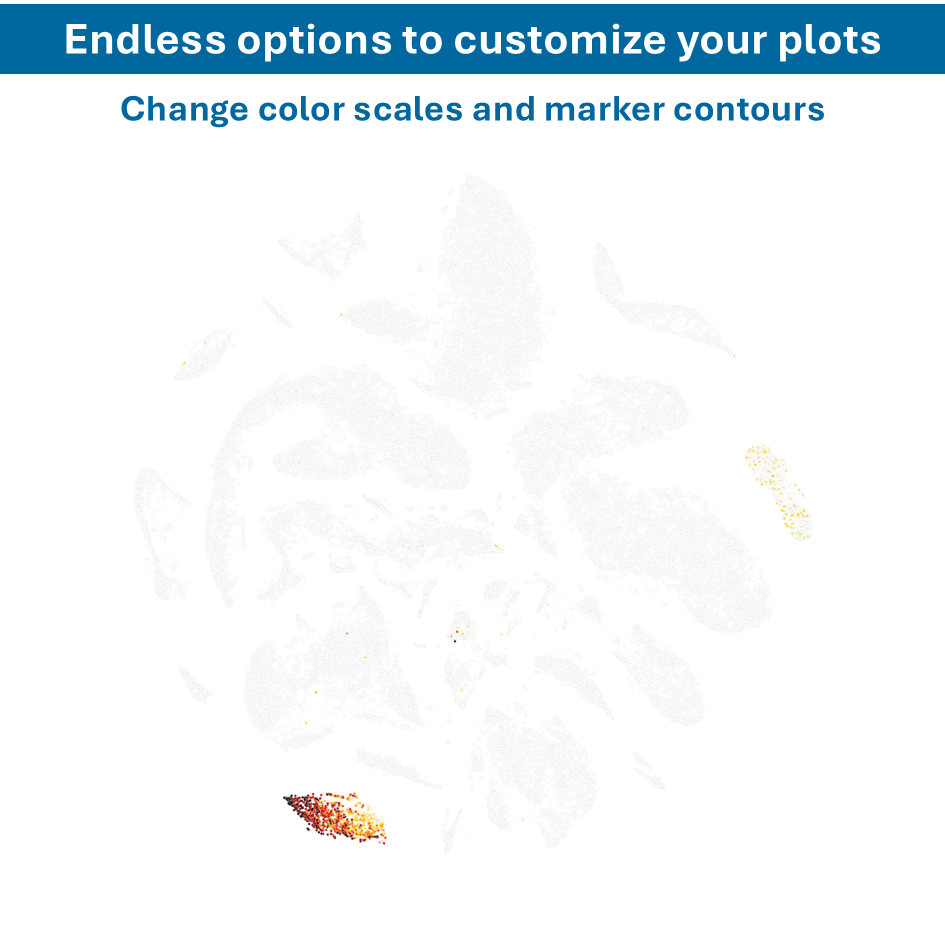
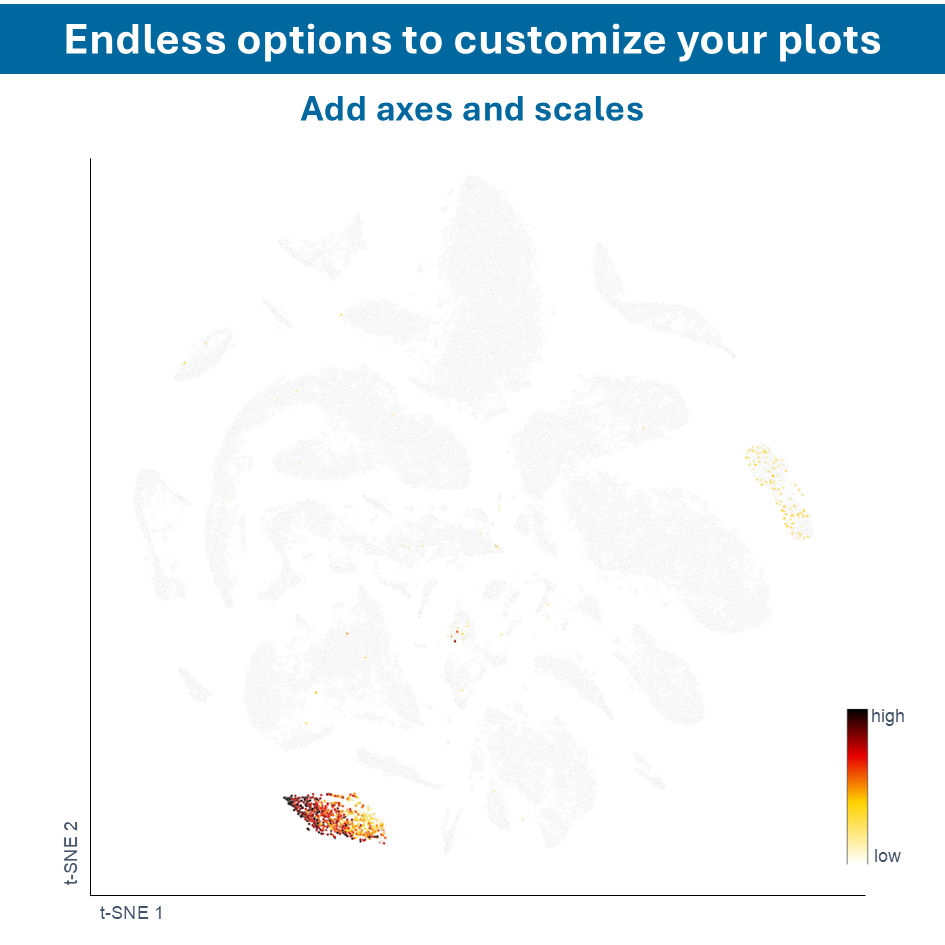
Publication-ready figures with highly customizable plots
Preparing analysis for publication-ready figures can be cumbersome process to address inconsistent labelling, low-resolution output, and time-consuming customization. The UniApp allows you to seamlessly transfer your highly customizable plots into a publication ready figure including consistent labelling and custom color schemes. With multiple export options and pre-designed templates, you can produce clear, precise, and visually appealing plots effortlessly. The tool saves you vast amounts of time, ensures consistency across all visualization and enhances reproducibility, making it an essential resource for producing professional, publication-quality figures.
Unprecedented interactive data exploration
The UniApp facilitates interactive engagement with your data through dynamic presentation and analysis. This enables you to continuously focus on interpretation and your thought processes, without the disruption of coding or screen-switching. Interactive visualizations, unlike static charts and graphs, allow manipulation of data and visuals in real-time for deeper insights. This can also be used for exploratory data analysis, where you can experiment with different visualizations and data segments to uncover pattern trends, and anomalies at an early stage in your data study.
Some of the key characteristics of interactivity in the UniApp includes

User Interaction
Clicking, hovering, zooming, and dragging to explore different dataset aspects
Dynamic Filtering
Controls like sliders, dropdowns, and checkboxes enable to filter and adjust displayed data
Real-time Updates
Changes such as filter adjustments or parameter changes will update visualizations real-time
Drill-down Capabilities
Click on elements of the visualization to drill down into more detailed views or related data points
Customizable Views
Real-time customization of data visualizations, including color, style, or chart type
Unlock the potential of your data with Unicle’s preliminary biomedical data vizualizations. Ensure your data is quickly and accurately analyzed to generate valuable insights and advance your projects with confidence.
Related modules

Cloud compute power
Leverage the power of cloud computing to drastically reduce analysis runtimes without specific hardware and tap into the potential of performing large data studies

Project management tools
Build your research paper storyline with interactive figure panels readily to present while keeping track of data files, versions and tasks

Collaboration tools
Effortlessly work together on research projects, share data collections or present your study interactively, while maintaining control over your results

Data organization
Gain control over your valuable data files in a single secured environment, allowing you to easily share data and collaborate
Proud to accelerate biomedical research at our clients


Request a demo
Fill in the form and we’ll contact you.